Curve Fitting
The Curve Fitting app within the Ganymede platform provides a comprehensive solution for analyzing dose-response, standard curves, and binding assays. This specialized application automates regression analysis while enabling interactive outlier management and maintaining complete audit trails. The app supports various regression models including linear, 4-parameter logistic (4PL), 5-parameter logistic (5PL), and custom equations, enabling standardized curve fitting workflows across your organization.
Overview
As part of the Ganymede data platform, the Curve Fitting app transforms how laboratories analyze concentration-response data by providing interactive visualization, automated regression fitting, and outlier management in a single unified interface. The app eliminates manual curve fitting in spreadsheets while ensuring consistency across different users and experiments. Users can iteratively refine fits, document exclusion decisions, and generate validated results while maintaining full traceability for regulatory compliance.
Common Use Cases
The Curve Fitting app excels in various analytical scenarios:
- Dose-Response Analysis — Determine IC50/EC50 values for drug discovery
- Antibody Titer Determination — Quantify antibody concentrations from serial dilutions
- Protein Quantification — Generate standard curves for BCA, Bradford, and other assays
- Receptor-Ligand Binding — Analyze binding kinetics and affinity constants
- ELISA Standard Curves — Fit calibration curves for immunoassays
- Cell Viability Assays — Calculate growth inhibition and cytotoxicity
- Bioassay Potency — Determine relative potency for lot release
- Enzyme Kinetics — Fit Michaelis-Menten and inhibition curves
The features shown below provide a representative set of capabilities available in the Curve Fitting app. Your implementation will be tailored to your specific assay types, regression models, and analytical requirements.
Representative Analysis Workflow
The Curve Fitting app follows a logical workflow that guides users through data analysis:
| Step | Action | Description |
|---|---|---|
| 1️⃣ | Data Import | Load experimental data from Ganymede's data lake with automatic parsing |
| 2️⃣ | Model Selection | Choose appropriate regression model (linear, 4PL, 5PL, custom) |
| 3️⃣ | Initial Fit | Generate curve with calculated parameters and goodness-of-fit metrics |
| 4️⃣ | Interactive Refinement | Click data points to exclude outliers with real-time updates |
| 5️⃣ | Documentation | Annotate exclusion decisions for complete audit trail |
| 6️⃣ | Results Export | Save validated curves and parameters back to Ganymede |
The workflow steps shown are representative. Your implementation will be customized to integrate seamlessly with your existing processes, performing only the relevant steps within the Ganymede app while maintaining your established laboratory workflows.
Key Features
Data Loading and Visualization
Efficiently load and visualize concentration-response data with comprehensive metadata:
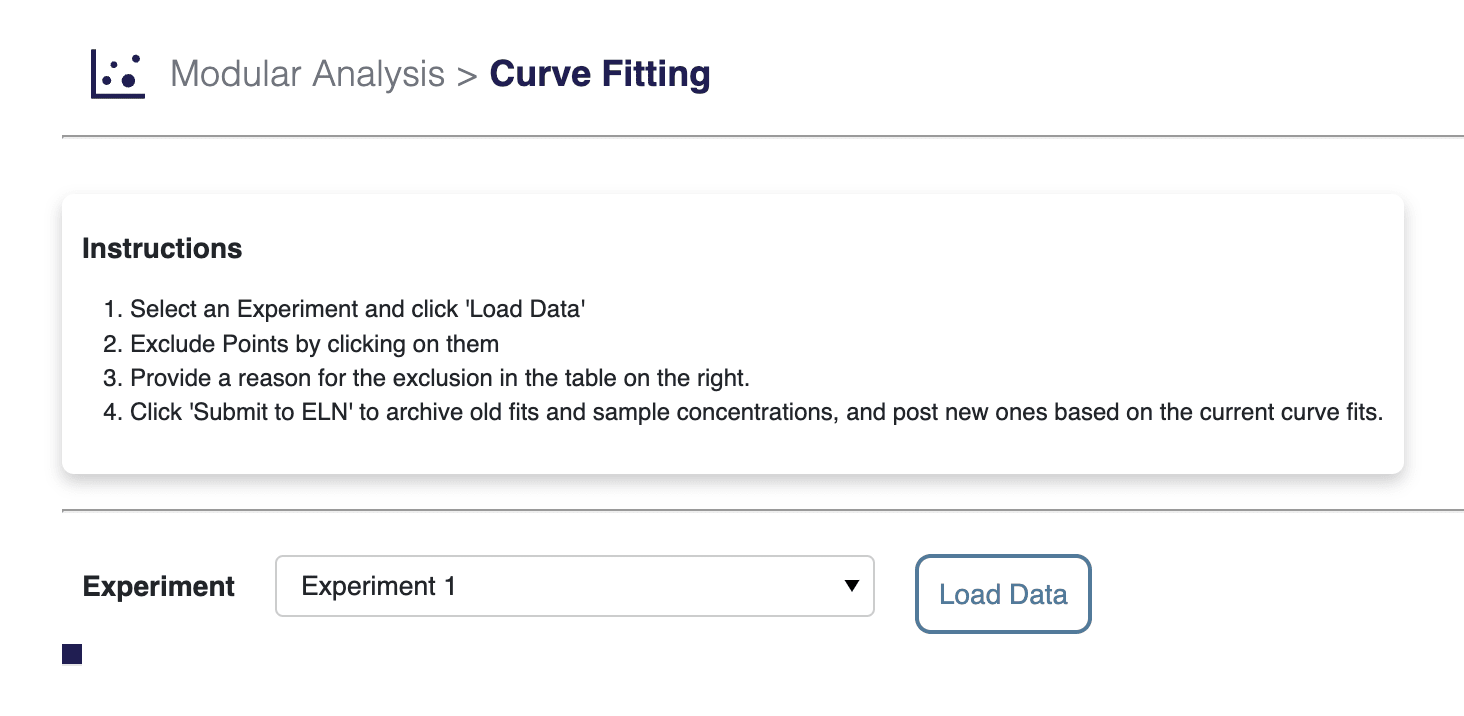
The app provides clear instructions and intuitive controls for data loading and analysis setup.
- Multiple data sources — Import from plates, tubes, or custom formats
- Automatic plotting — Instant visualization of concentration-response relationships
- Metadata integration — Display sample names, conditions, and experimental details
- Interactive tooltips — Hover to view detailed information for each data point
Advanced Curve Fitting
Generate regression fits with multiple model options and real-time parameter calculation:
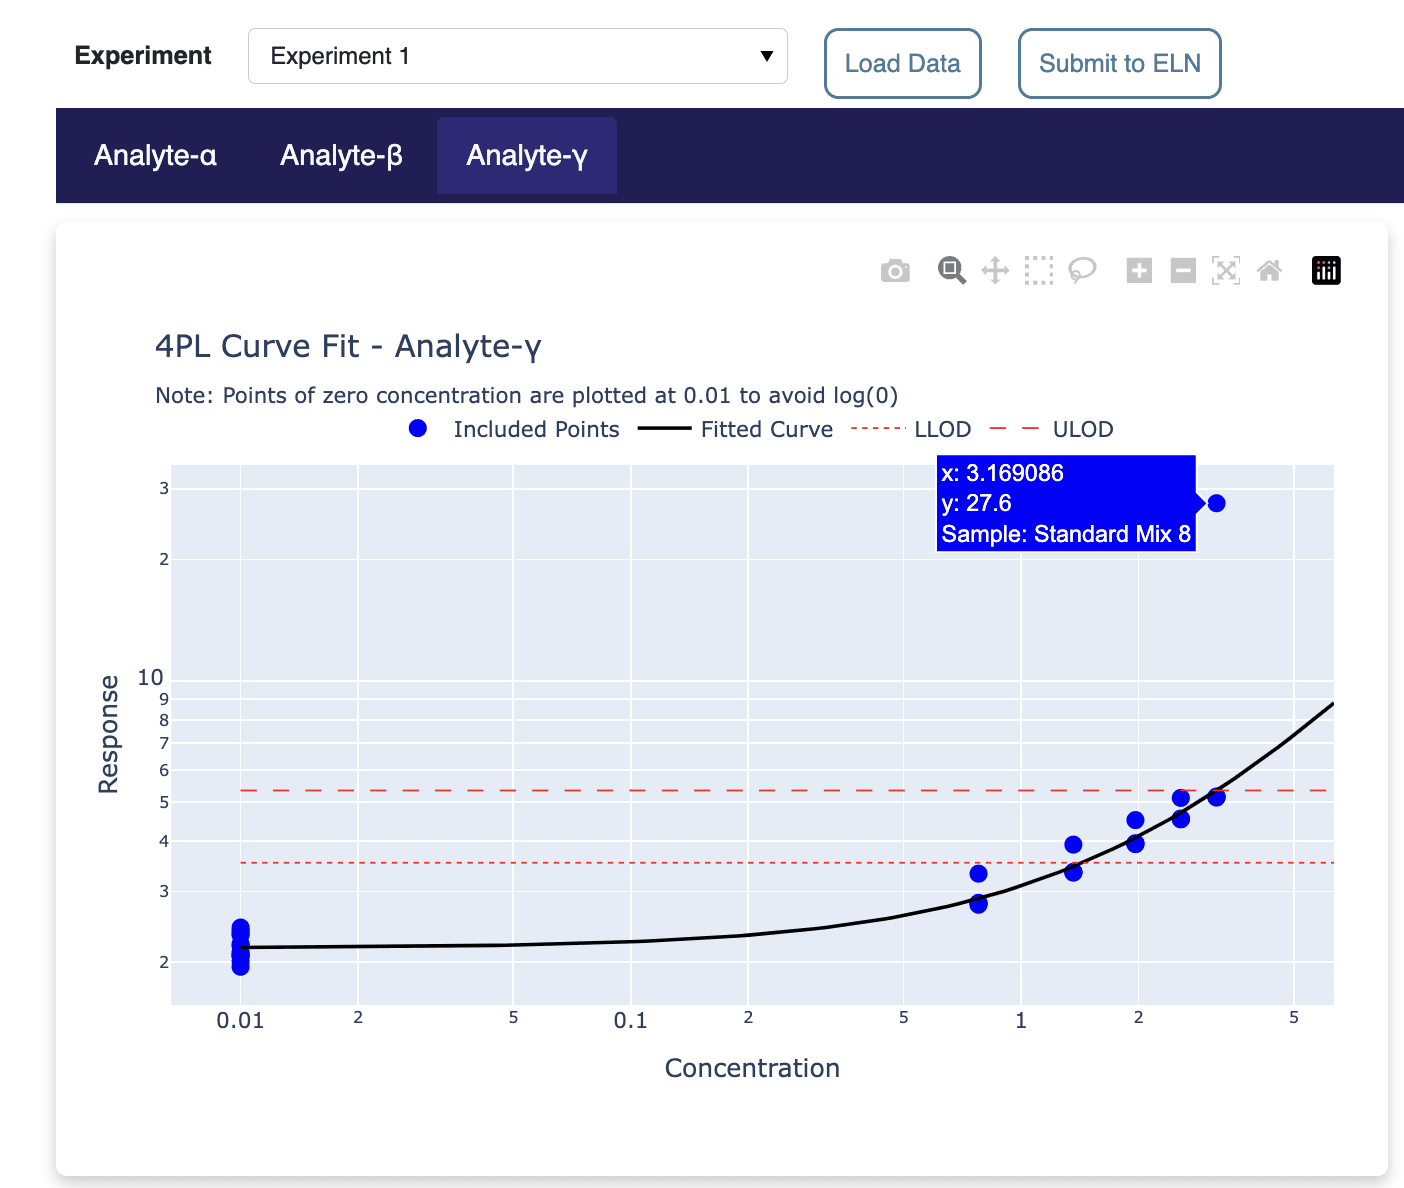
The app automatically fits data to the selected regression model, displaying the curve with confidence bands and calculated parameters.
Supported Regression Models
| Model Type | Parameters | Common Applications |
|---|---|---|
| Linear | Slope, Intercept | Standard curves with narrow range |
| 4PL (Four Parameter Logistic) | Min, Max, IC50, Hill Slope | Dose-response, ELISA |
| 5PL (Five Parameter Logistic) | Min, Max, IC50, Hill Slope, Asymmetry | Asymmetric curves, immunoassays |
| Hill Equation | Vmax, Km, n | Enzyme kinetics, cooperativity |
| Exponential | A, k | Growth curves, decay kinetics |
| Custom Equations | User-defined | Specialized assay requirements |
Interactive Outlier Management
Identify and exclude outliers with full documentation and real-time fit updates:
Click any data point to toggle its inclusion in the fit. Excluded points are marked in red (configurable for accessibility).
- Click-to-exclude — Simple point selection for outlier identification
- Visual feedback — Color and shape changes for excluded points
- Real-time updates — Instant recalculation of fit parameters
- Undo/redo support — Easily revert exclusion decisions
- Batch operations — Exclude multiple points based on criteria
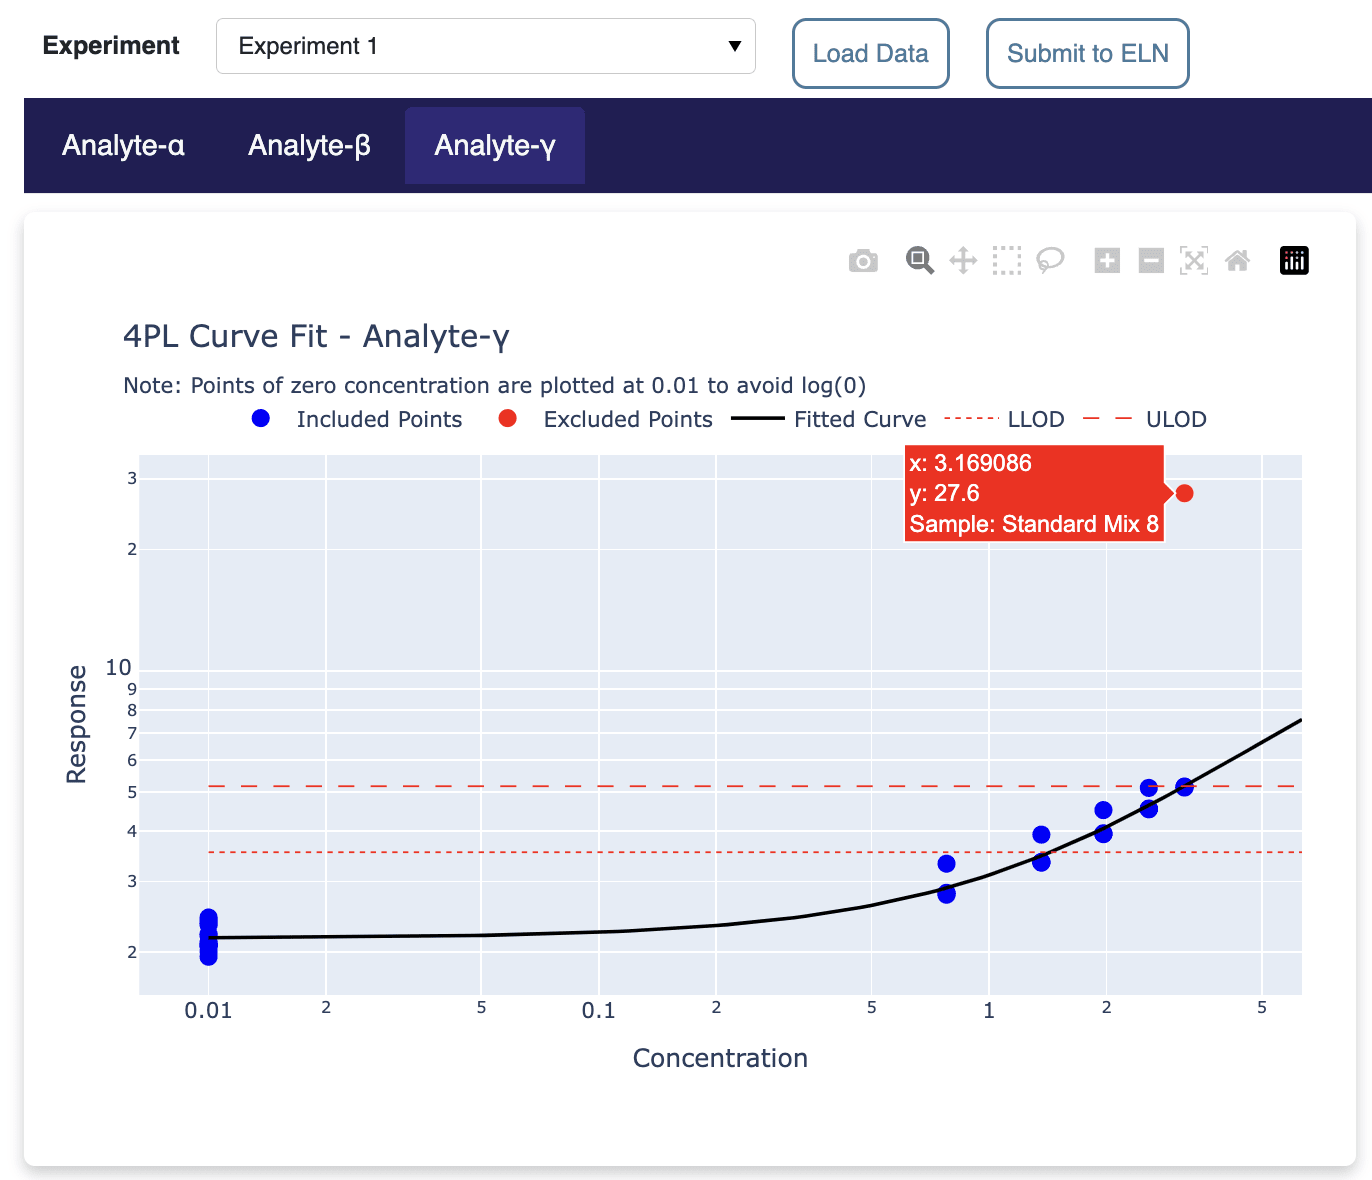
Results Validation and Metrics
Comprehensive metrics display with annotation capabilities for excluded points:
Document reasons for point exclusion and review all fit metrics in a comprehensive summary table.
Quality Metrics
| Metric | Description | Acceptance Criteria |
|---|---|---|
| R² | Coefficient of determination | Typically >0.95 |
| IC50/EC50 | Half-maximal concentration | Within expected range |
| Hill Slope | Curve steepness | -3 to -0.3 for typical assays |
| 95% CI | Confidence intervals | Narrow bands indicate good fit |
| Residuals | Difference from fit | Random distribution expected |
| Z-factor | Assay quality metric | >0.5 for screening assays |
Advanced Analysis Features
Additional capabilities for specialized analyses:
- Parallelism testing — Compare curves for similarity
- Relative potency — Calculate potency ratios between samples
- Linear range detection — Identify optimal quantification range
- Weighting options — 1/Y, 1/Y², or custom weighting schemes
- Constraint setting — Fix parameters or set bounds
- Global fitting — Fit multiple curves with shared parameters
Data Types Analyzed
The Curve Fitting app processes various types of concentration-response data:
Raw Measurement Data
- Absorbance values — Colorimetric assay readouts
- Fluorescence intensities — Fluorescent assay signals
- Luminescence counts — Reporter gene and viability assays
- Concentration series — Dilution schemes and stock concentrations
- Replicate measurements — Technical and biological replicates
Calculated Parameters
- IC50/EC50 values — Half-maximal inhibitory/effective concentrations
- Slope parameters — Hill slope, linear slope coefficients
- Dynamic range — Minimum and maximum asymptotes
- Confidence intervals — Parameter uncertainty estimates
- Goodness-of-fit — R², adjusted R², RMSE
Quality Control Data
- Outlier flags — Automated and manual exclusions
- Exclusion reasons — User annotations for audit trail
- Replicate statistics — CV%, standard deviations
- Assay controls — Positive/negative control values
Data Integration
The Curve Fitting app seamlessly integrates with Ganymede's data infrastructure:
Data Management Features
- Direct data lake connection — Access all assay data stored in Ganymede tables
- Automatic data parsing — Extract concentration-response pairs and metadata
- Template management — Save and reuse analysis configurations
- Batch processing — Analyze multiple curves simultaneously
- Version control — Track analysis iterations and parameter changes
- Audit trail maintenance — Complete record of exclusions and decisions
Export Capabilities
| Export Type | Formats | Contents |
|---|---|---|
| Raw Data | CSV, Excel | Original measurements with metadata |
| Fitted Curves | CSV, Excel, JSON | Parameters, fitted values, residuals |
| Reports | PDF, HTML | Complete analysis with figures and annotations |
| Figures | PNG, SVG, PDF | Publication-ready plots |
| Analysis Log | JSON, CSV | Audit trail of all user actions |
Customization Options
The Curve Fitting app can be readily configured to suit specific assay requirements:
- Custom regression models — Add proprietary equations
- Assay-specific validations — Define acceptance criteria
- Automated outlier detection — Statistical methods for flagging
- Report templates — Customized output formats
- Integration workflows — Connect to LIMS or ELN systems
The Implementation team can help customize:
- Standard and baseline definitions
- Linear range determination algorithms
- Specialized curve fitting models
- Validation rules and acceptance criteria
Workflow Benefits
Implementing the Curve Fitting app in your laboratory workflows provides significant advantages:
- Reduced analysis time — Automate curve fitting that typically requires manual work
- Improved consistency — Standardize regression methods across all users
- Enhanced traceability — Document all exclusion decisions with reasons
- Better collaboration — Share validated curves across teams
- Regulatory compliance — Maintain complete audit trails for submissions
- Increased accuracy — Eliminate manual transcription and calculation errors
Learn More
The Curve Fitting app transforms concentration-response analysis from manual spreadsheet work into an efficient, validated workflow. To explore how the Curve Fitting app can be tailored to your specific assay requirements, contact your Ganymede representative or our sales team to learn more.