Modular Analysis Overview
Modular Analysis (MA) enables users to develop interactive web apps from Jupyter notebooks and deploy them to users in their Ganymede tenant. These applications are natively integrated with Ganymede data storage, enabling them to present context-rich interfaces for data capture and analyses.
Accessing Modular Analysis
To access MA, click on the
icon in the left sidebar.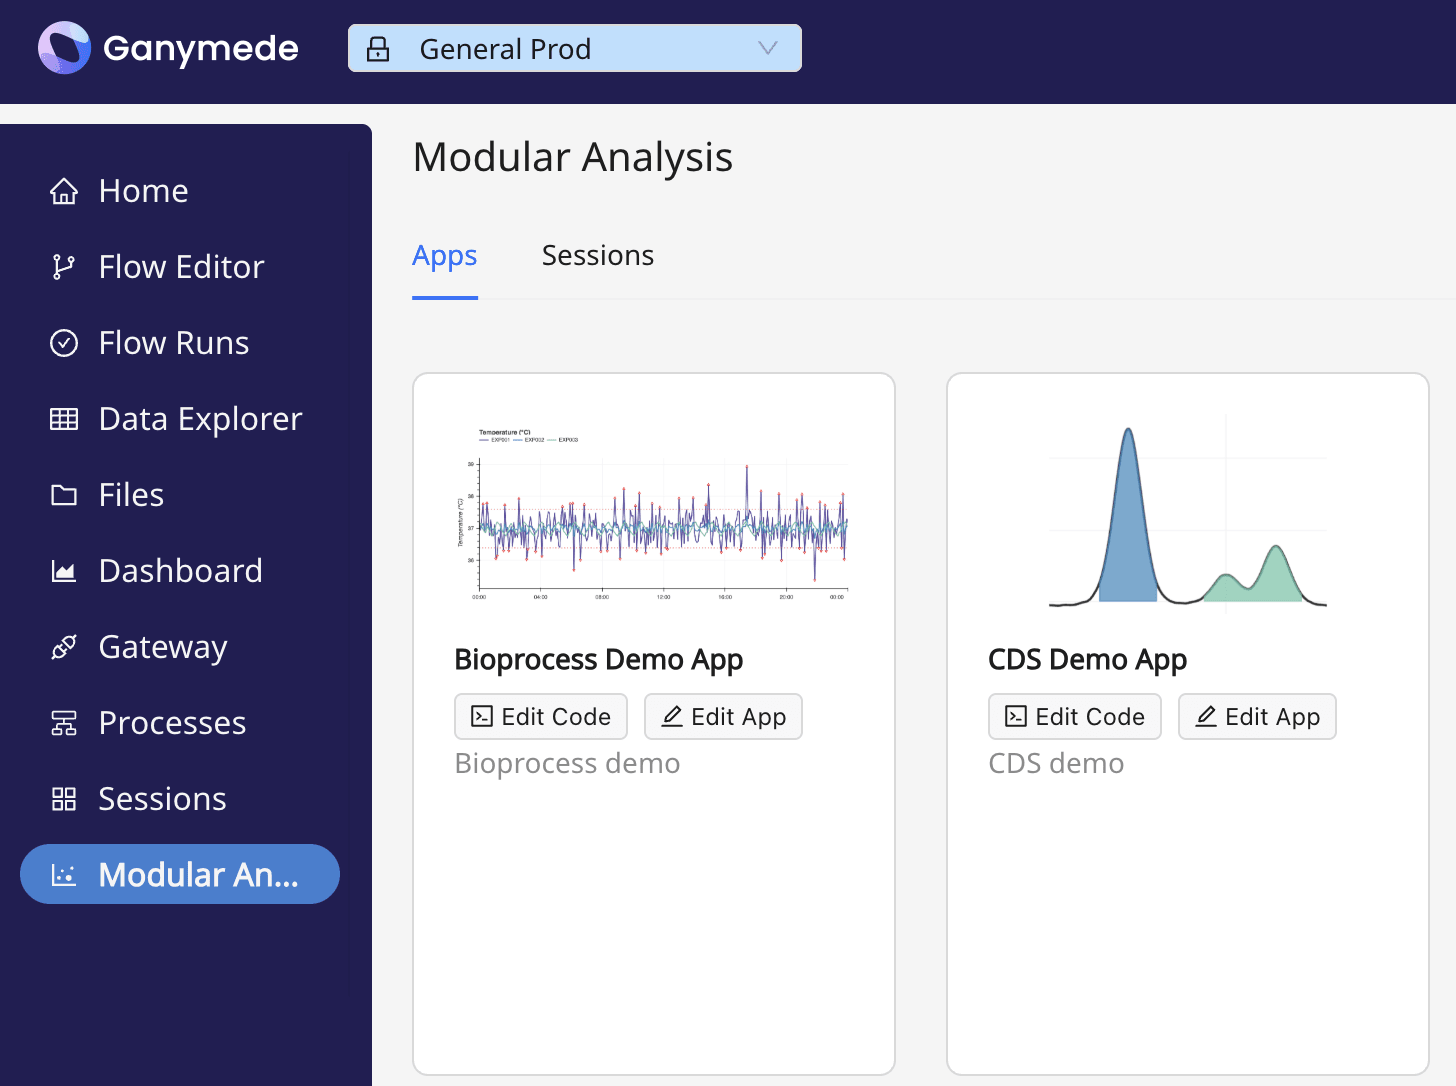
Each MA application receives its own tile, containing the name, description, and icon for the app, as well as the following buttons:
- : launch the MA application
- : edit the code behind an MA application in a Jupyter notebook
- : edit the name, description, and or icon on the tile for the app
Base Applications
Ganymede offers a set of base applications, which can be modified and adapted for your workflows.
For example, the base bioprocess MA application could be configured with campaign and run information specific to your labs, drawing from your LIMS or metadata derived from relevant instruments.
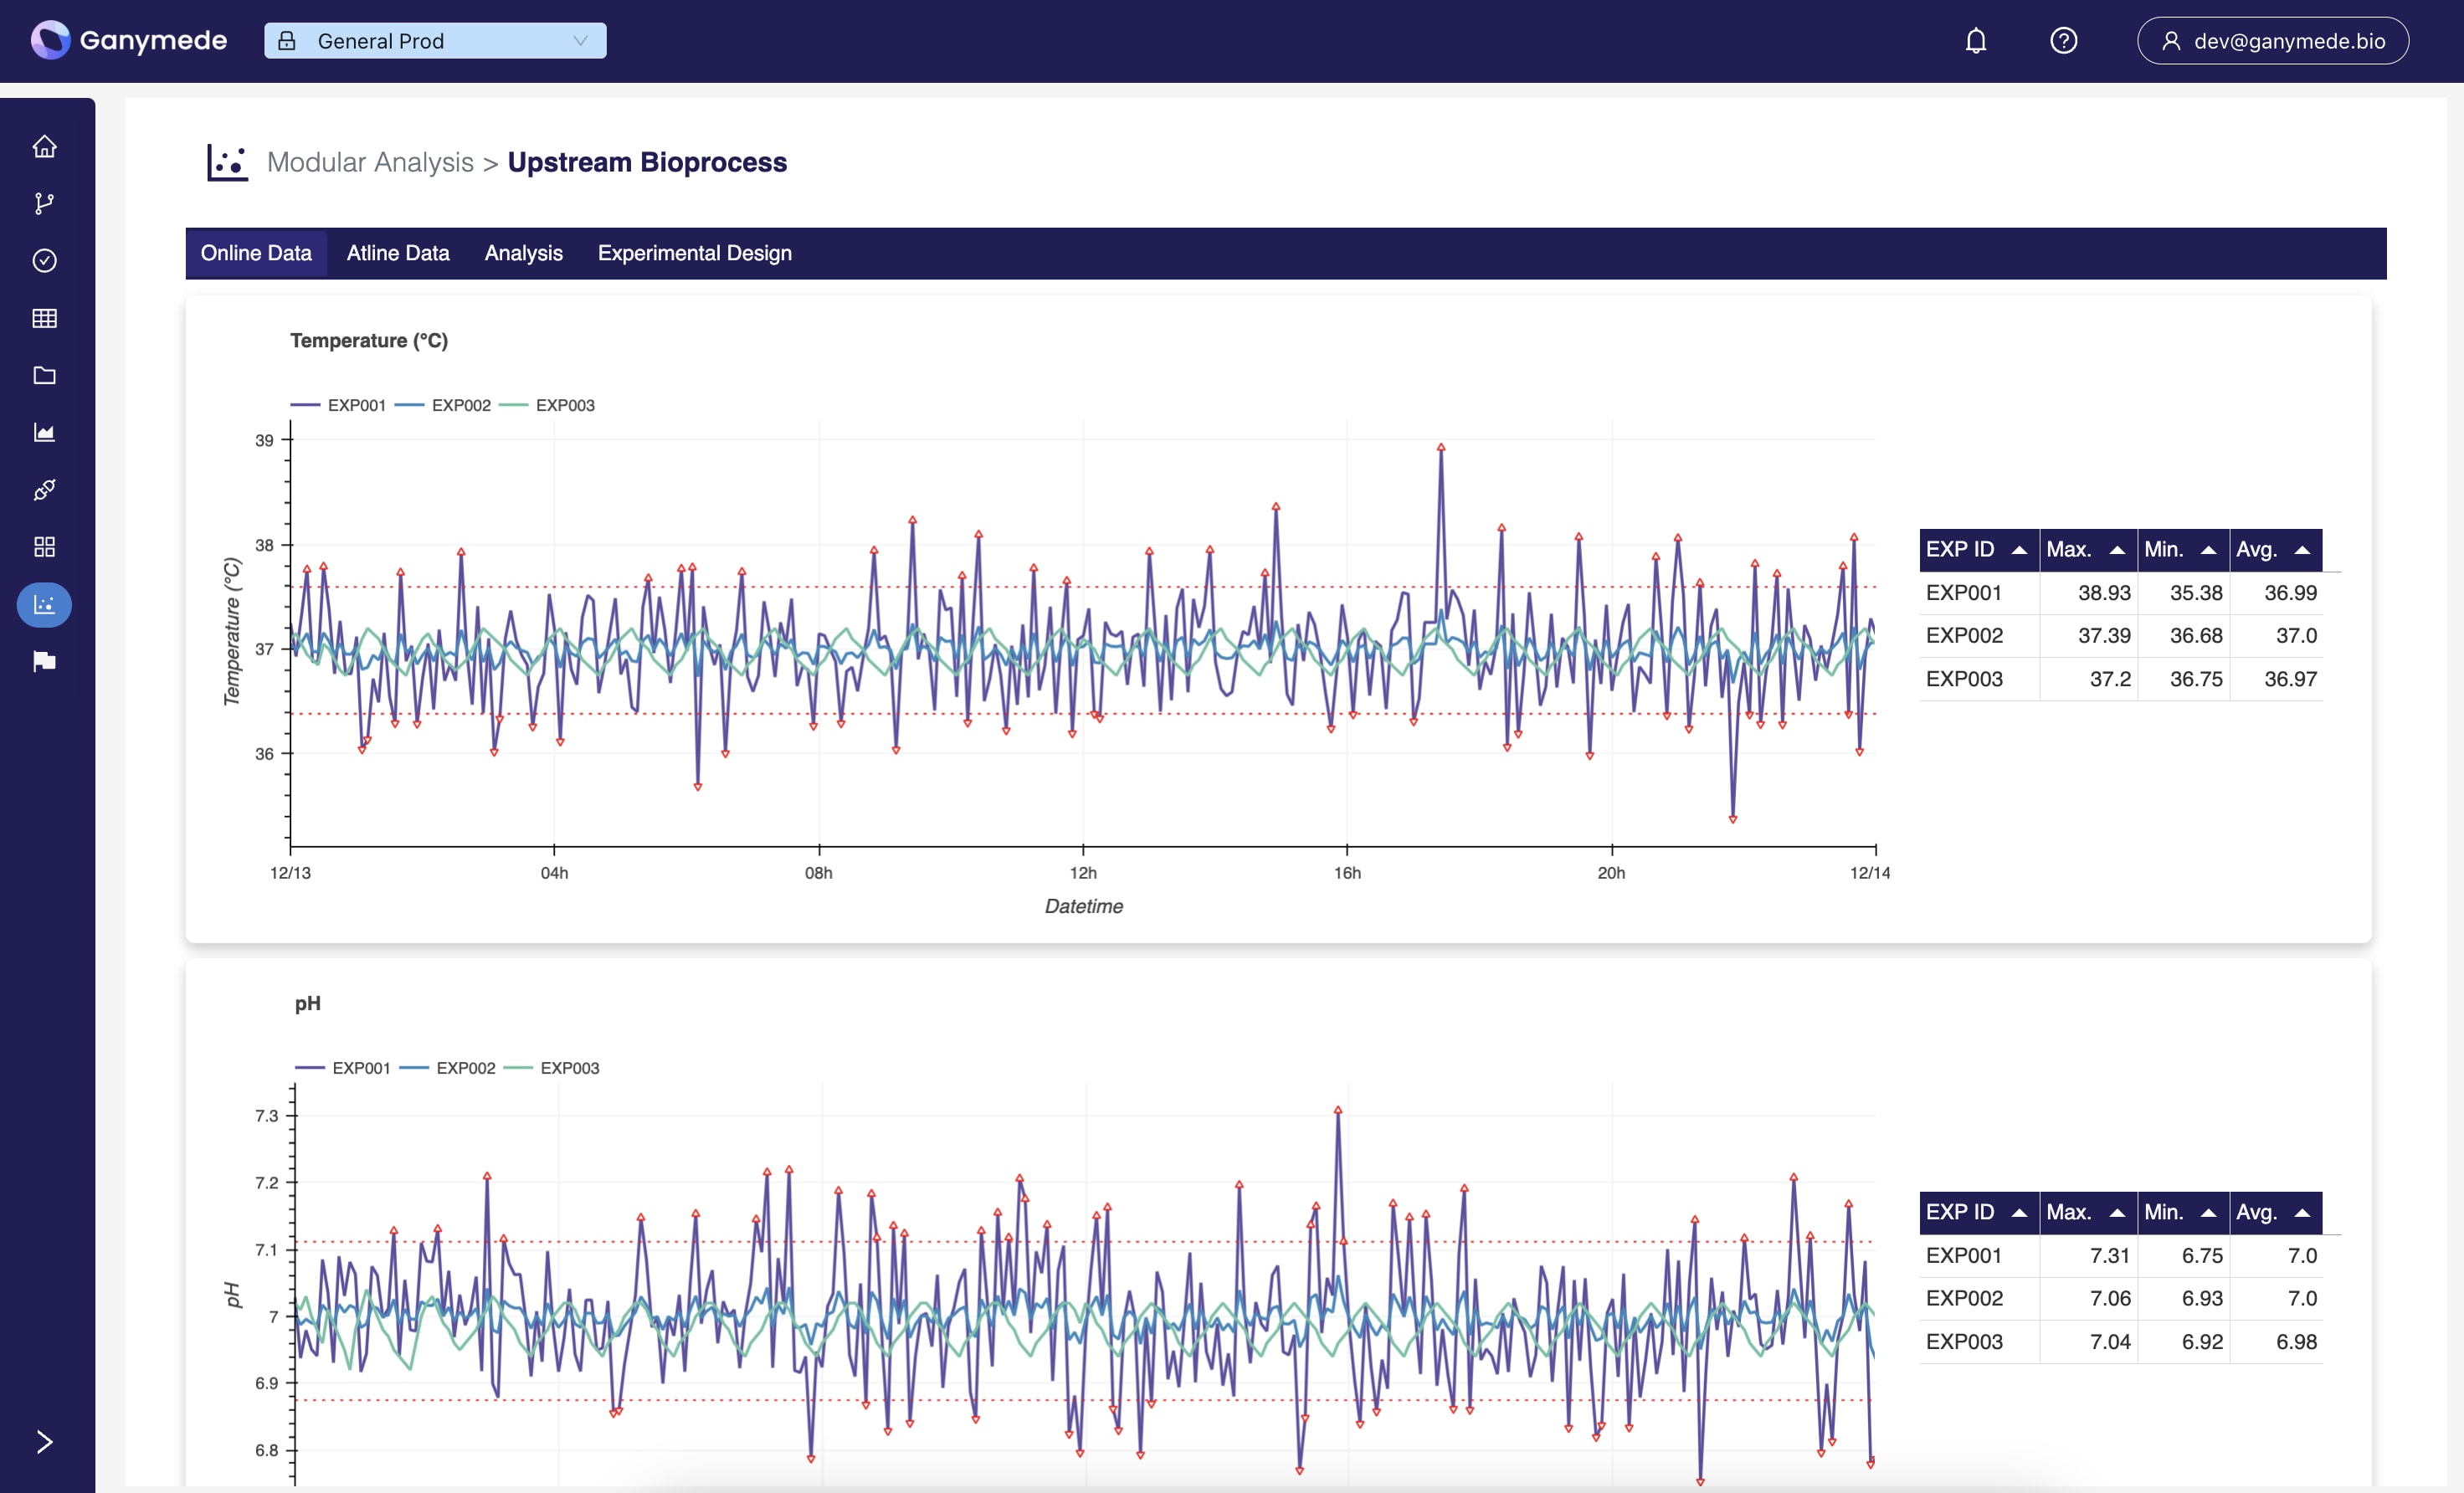
Upstream Bioprocess
Provides a single, vendor-agnostic interface for viewing online and atline data from your bioreactors.
Learn more about the Bioprocess app →
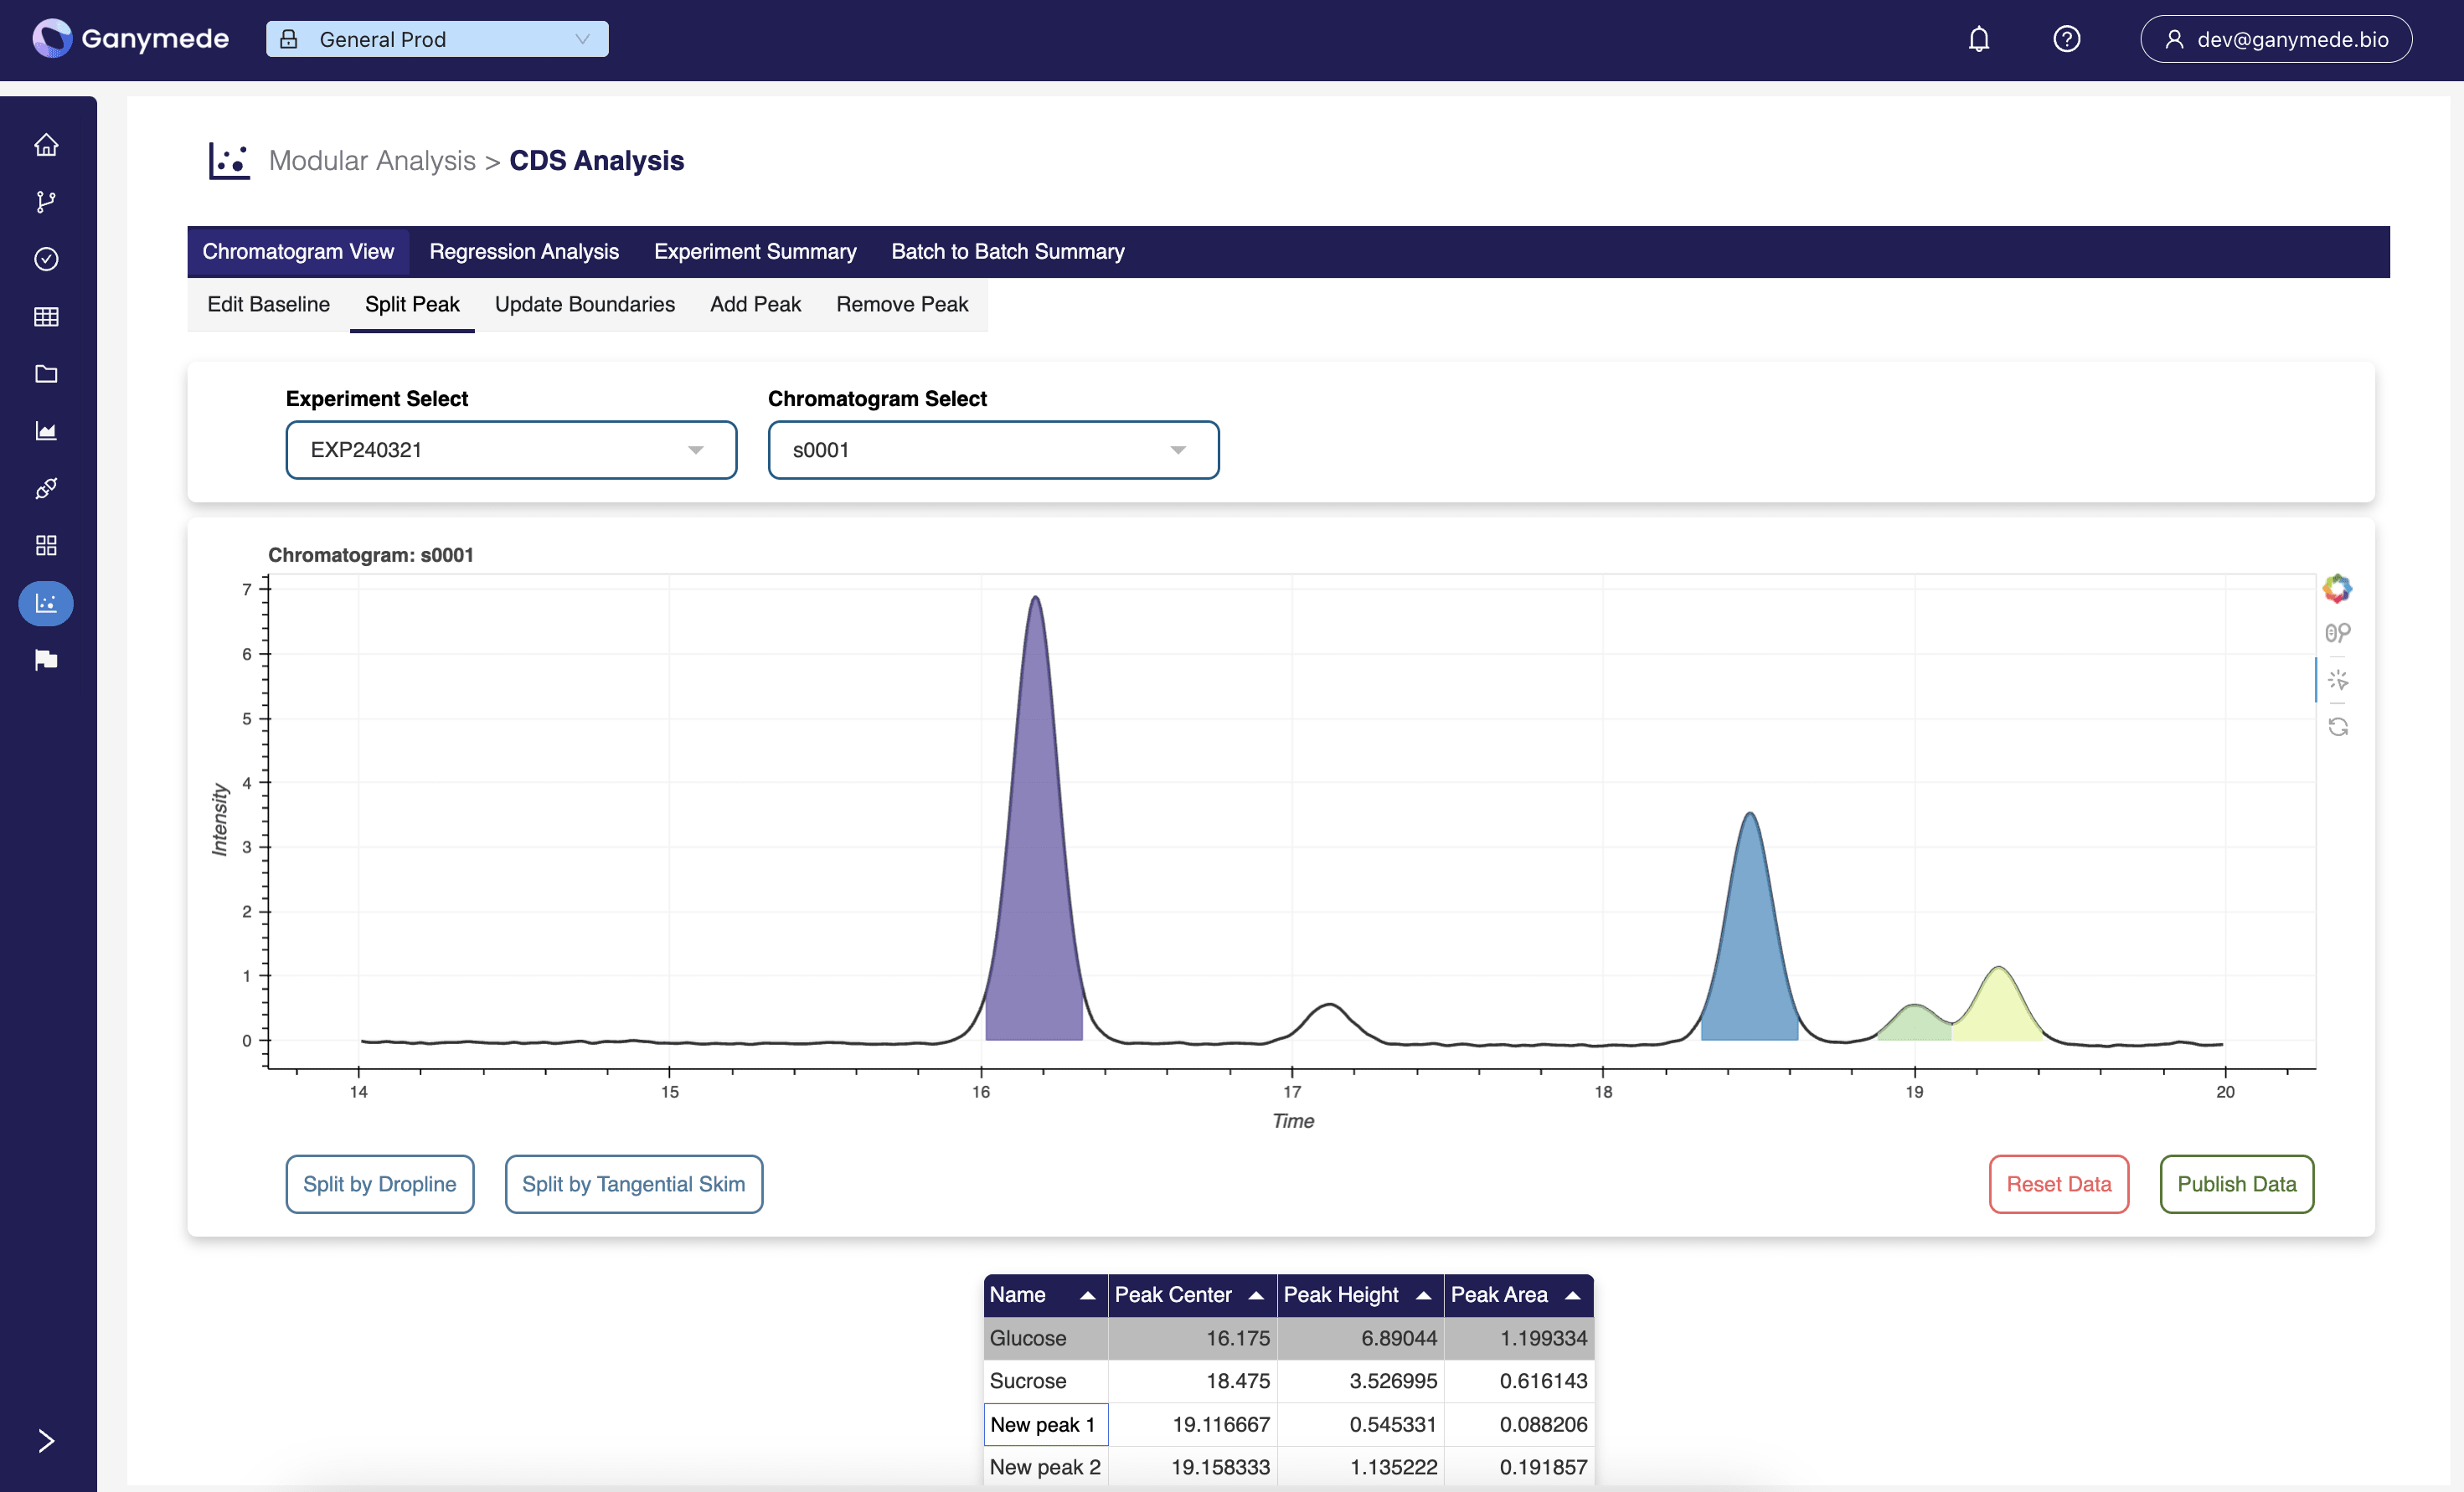
Chromatography
Enables human-in-the-loop validation on machine learning workflows for chromatography.
Learn more about the Chromatography app →
qPCR / ELISA / Plate-Based Assays
Visualize plate layout and results for qPCR, ELISA, protein quantification, reporter gene, and other plate-based assays.
Learn more about the qPCR app →

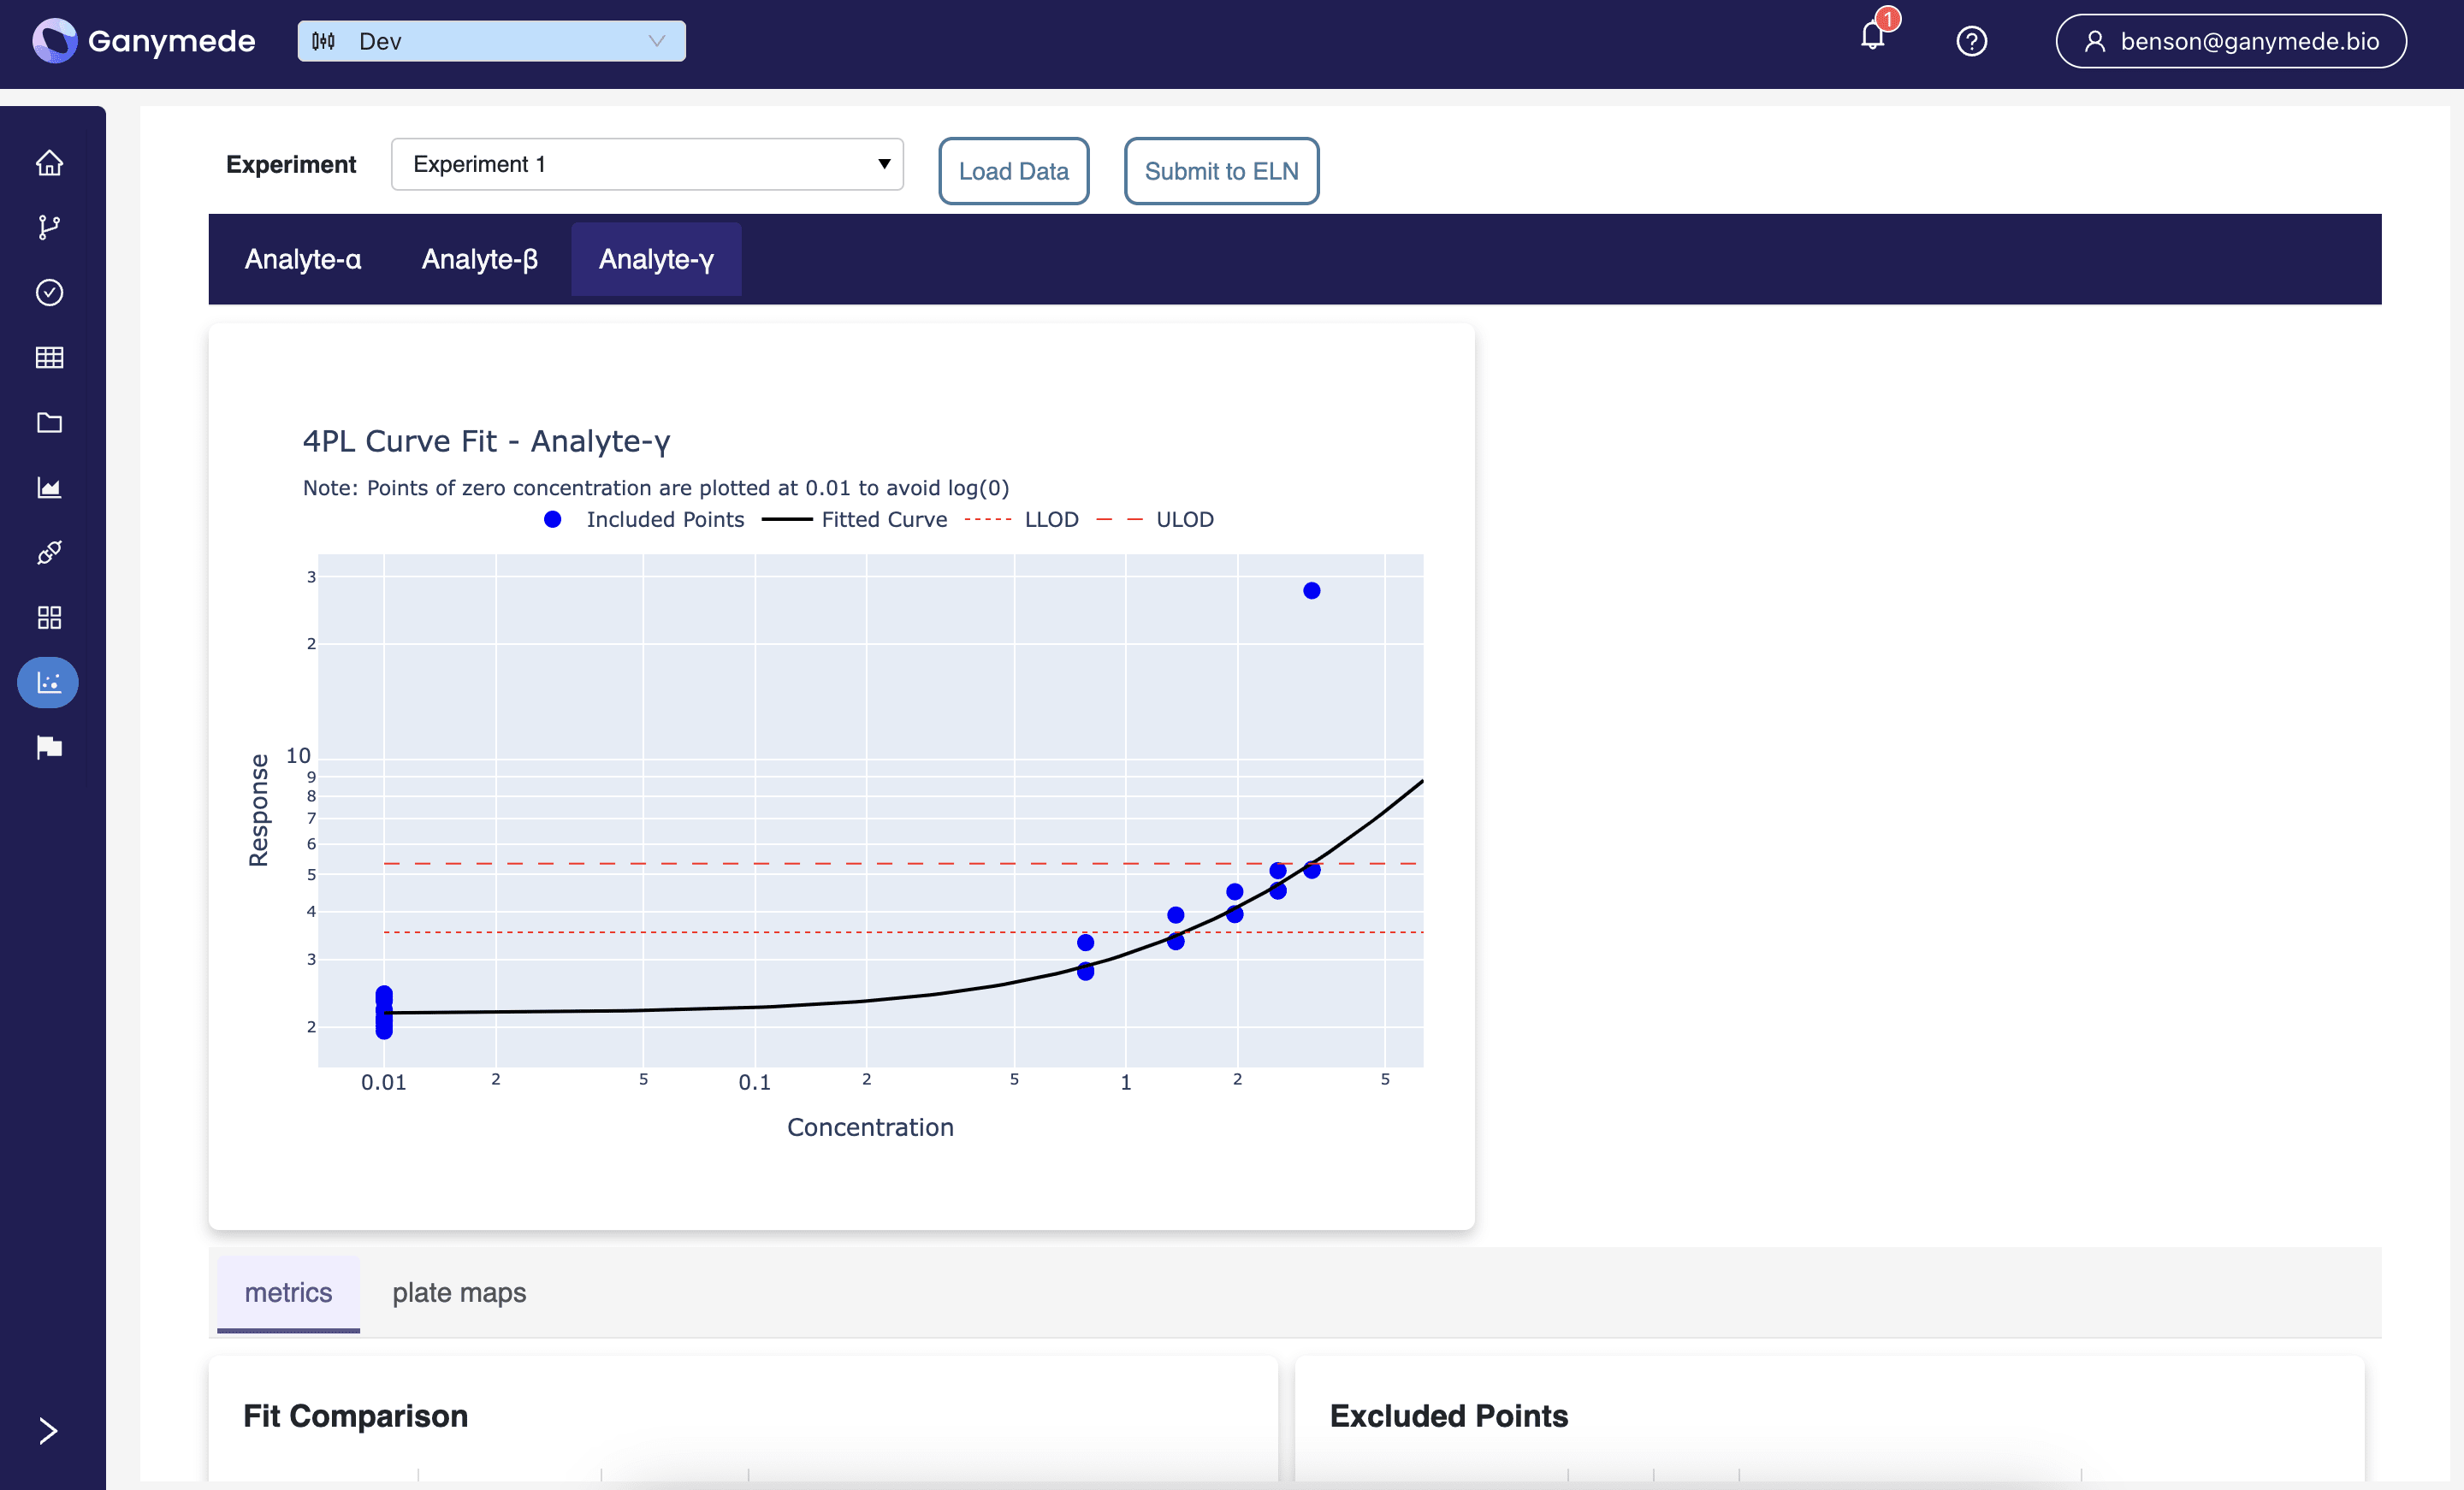
Dose Response / Receptor-Ligand Binding
Fit nonlinear regressions for dose-response / receptor-ligand binding assays, statefully capturing user and annotation for any identified outliers.
Learn more about the Curve Fitting app →