Running Flows
The
Running Flows
Flows can be run from the browser, from an Agent, from an event, or by configuring a browser-based file watcher. This sections below detail how Flows can be run from the browser.
Manually running Flows
To run a Flow manually, drop a file into the upload box and click the
button on the left side of the run box.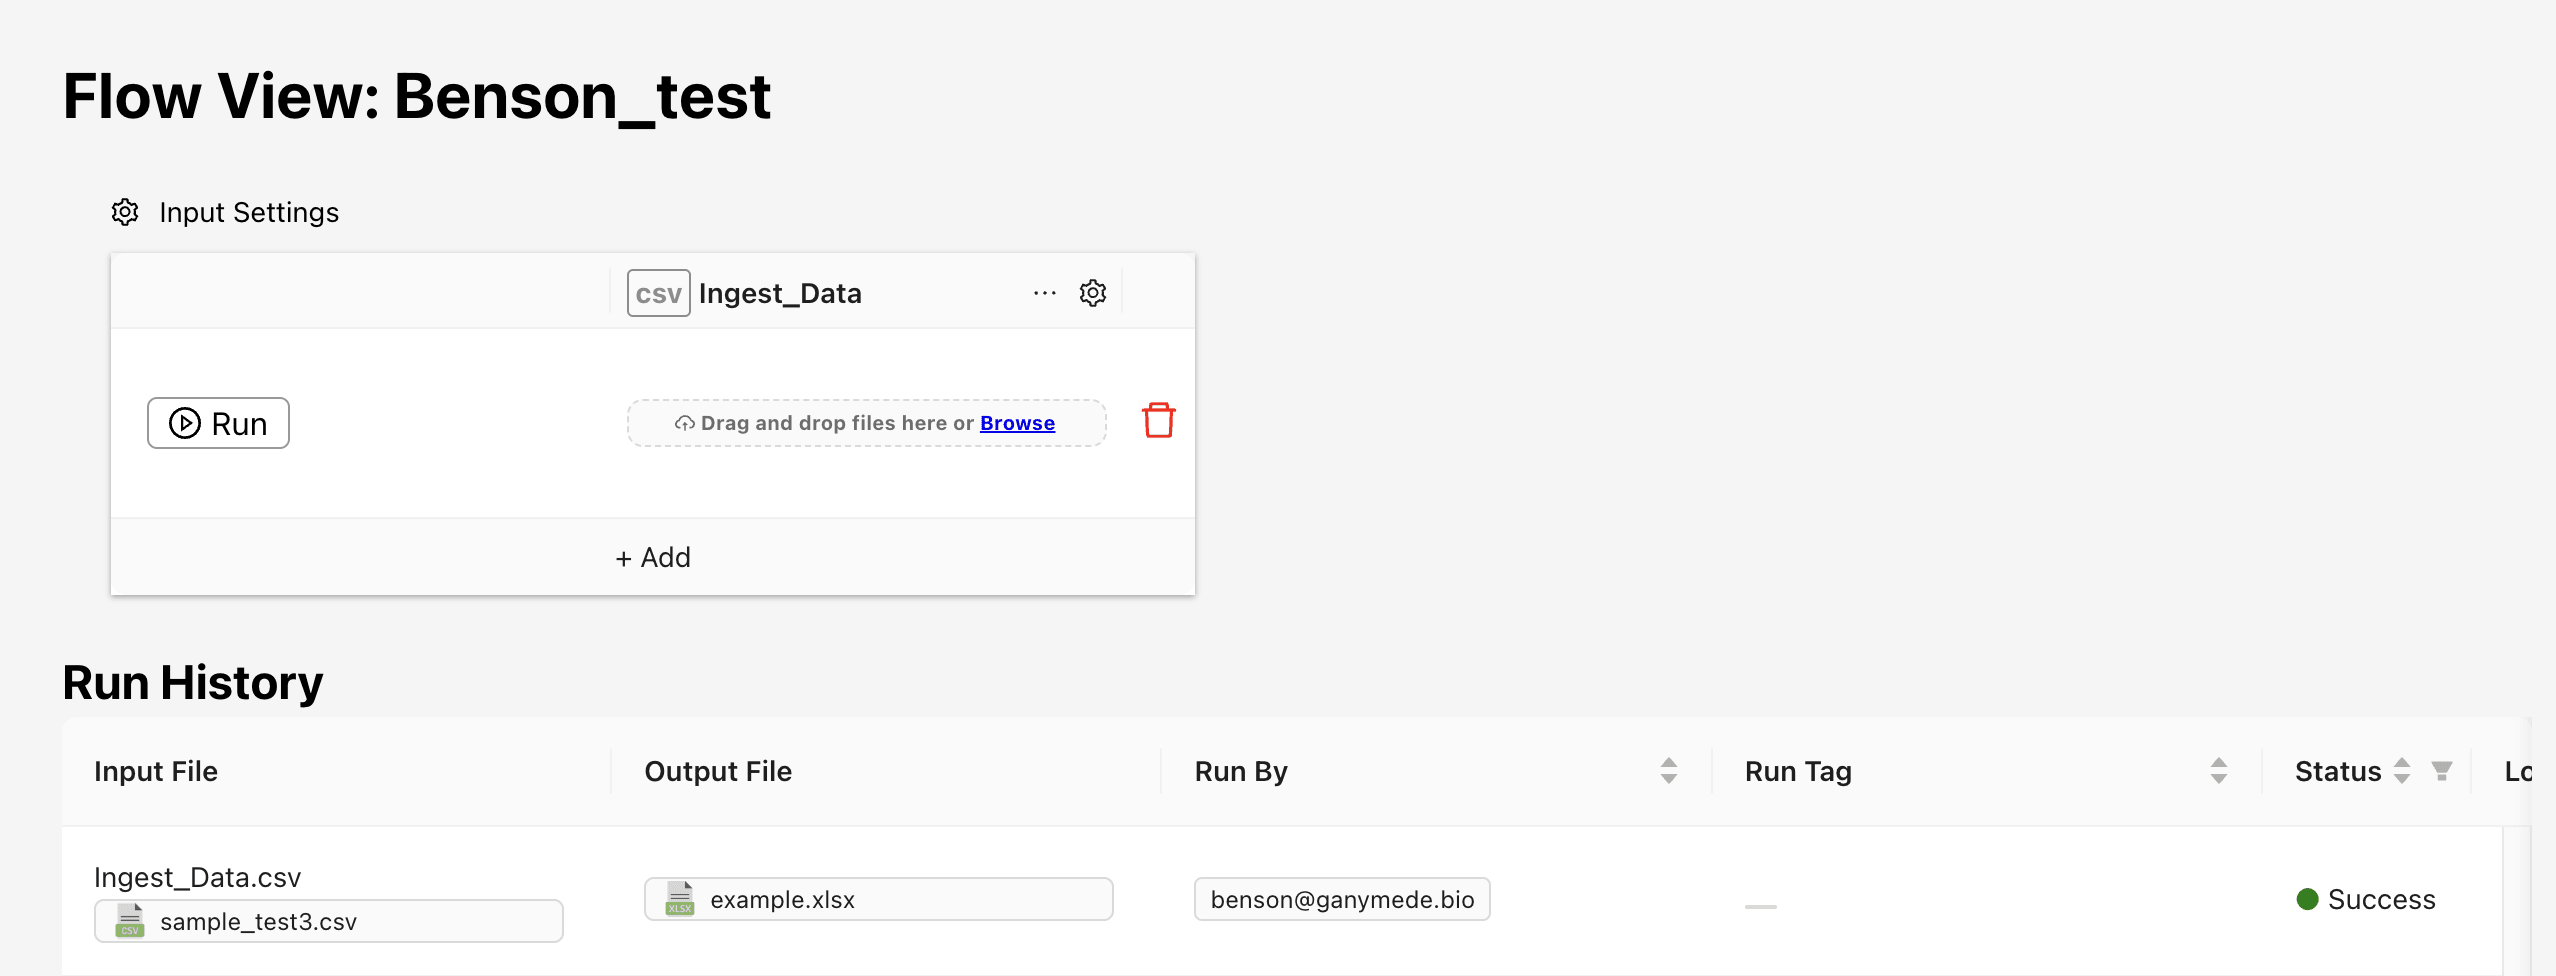
Watching directories for new files
Using the browser-based file watcher, Ganymede can be configured to watch for new files for processing, enabling hands-free file processing. This feature allows users to define a directory that is continuously watched for file additions or changes. When new files appear, they are automatically queued for processing in Ganymede.
To setup a browser-based file watcher, open up a flow on the
page or via the page. The flow inputs section, shown below, consists of a form input for the input types that have been defined for the flow. Inputs that accept files have a icon, which you can use to select the directory to be watched.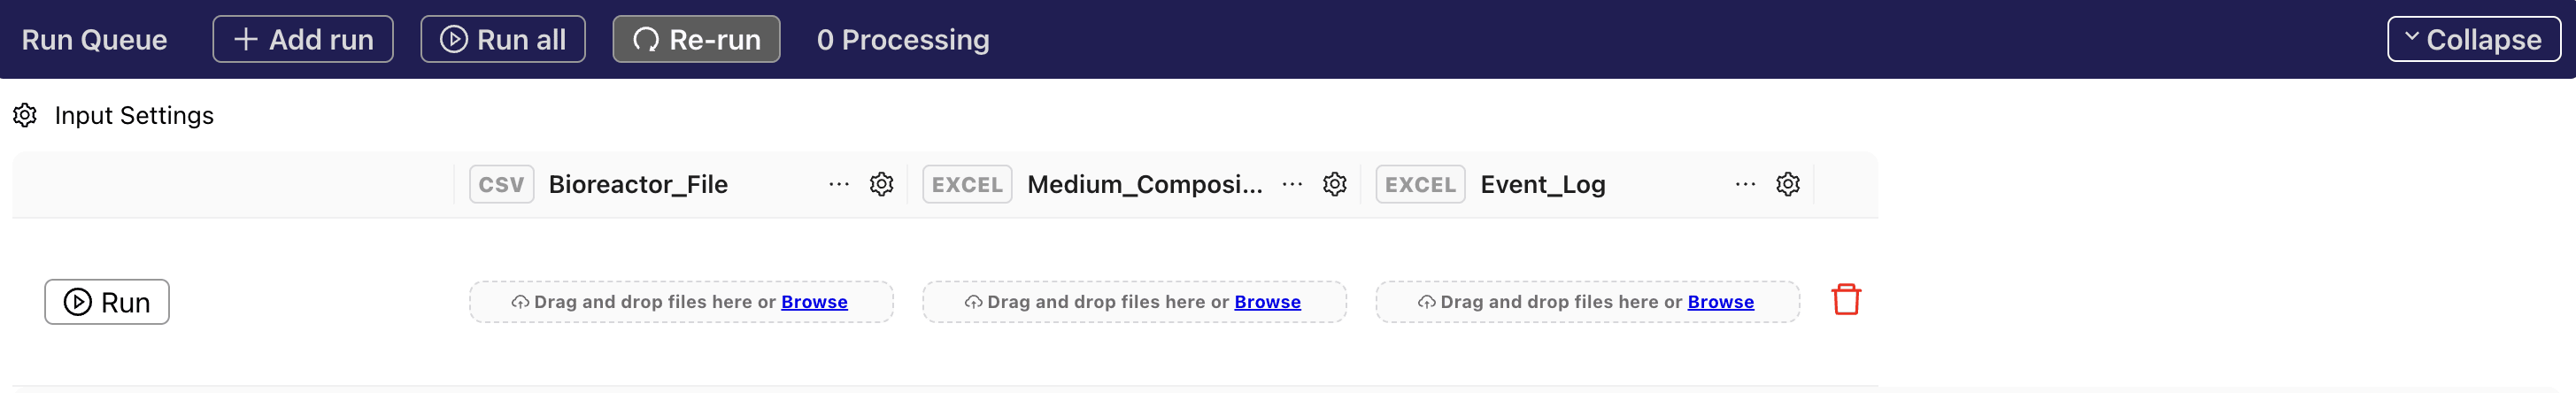
Browser-based file watcher configuration is done per node, not per flow.
Configuring directory watching
Clicking on the
icon exposes the modal for configuring directory watching.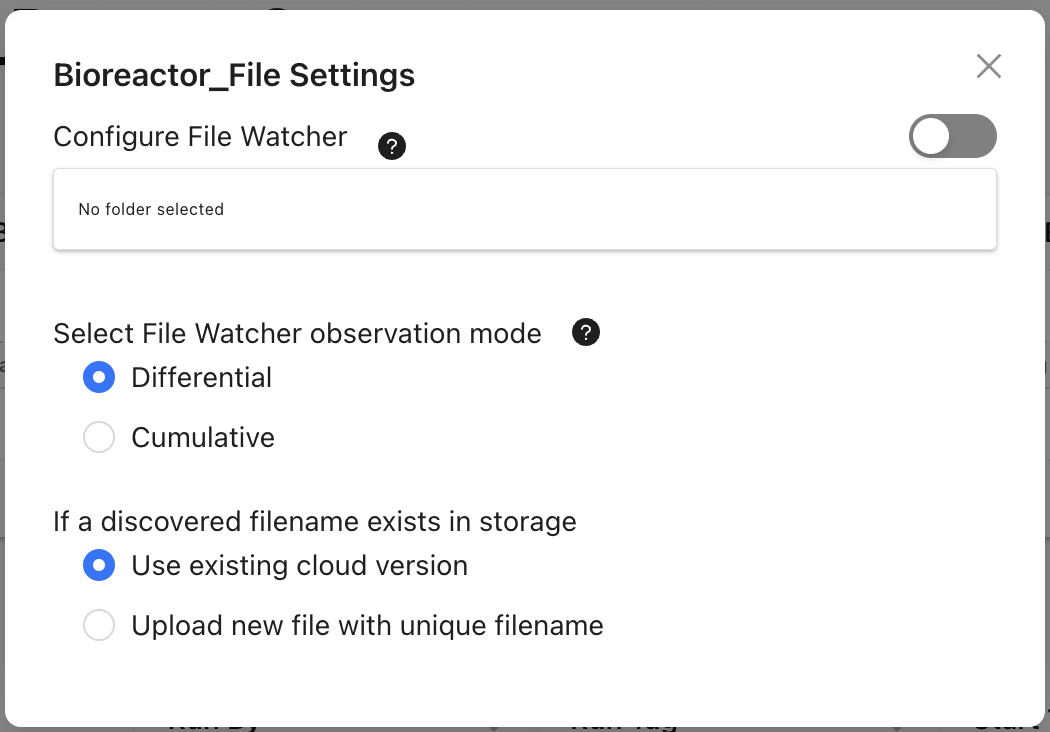
This produces a modal with two settings, the observation mode and the write mode.
The observation mode specifies which files are captured:
- Differential mode: detects files that are created or modified in a directory after the watcher starts.
- Cumulative mode: Captures all existing files in the directory and continues to monitor for any new or modified files.
The write mode defines how Ganymede Cloud handles observed files. When the watcher detects a file, it uploads the file to Ganymede independent of its mode. If a file with the same name already exists in Ganymede for a given flow and input, the watcher can:
- queue the existing file in the system to run, or
- upload the new file with a unique name to avoid conflicts.
After configuring the watcher, close the modal and click the file icon to select the directory. The watcher will continue to monitor that directory until the user refreshes or closes the site, or selects the 'X' icon that appears when watching a file.
Executing flows upon file detection
The file watcher can be configured to either queue runs or execute a run once all relevant files for the flow have been detected. To configure this, click on the
button and check off "Enable auto-run".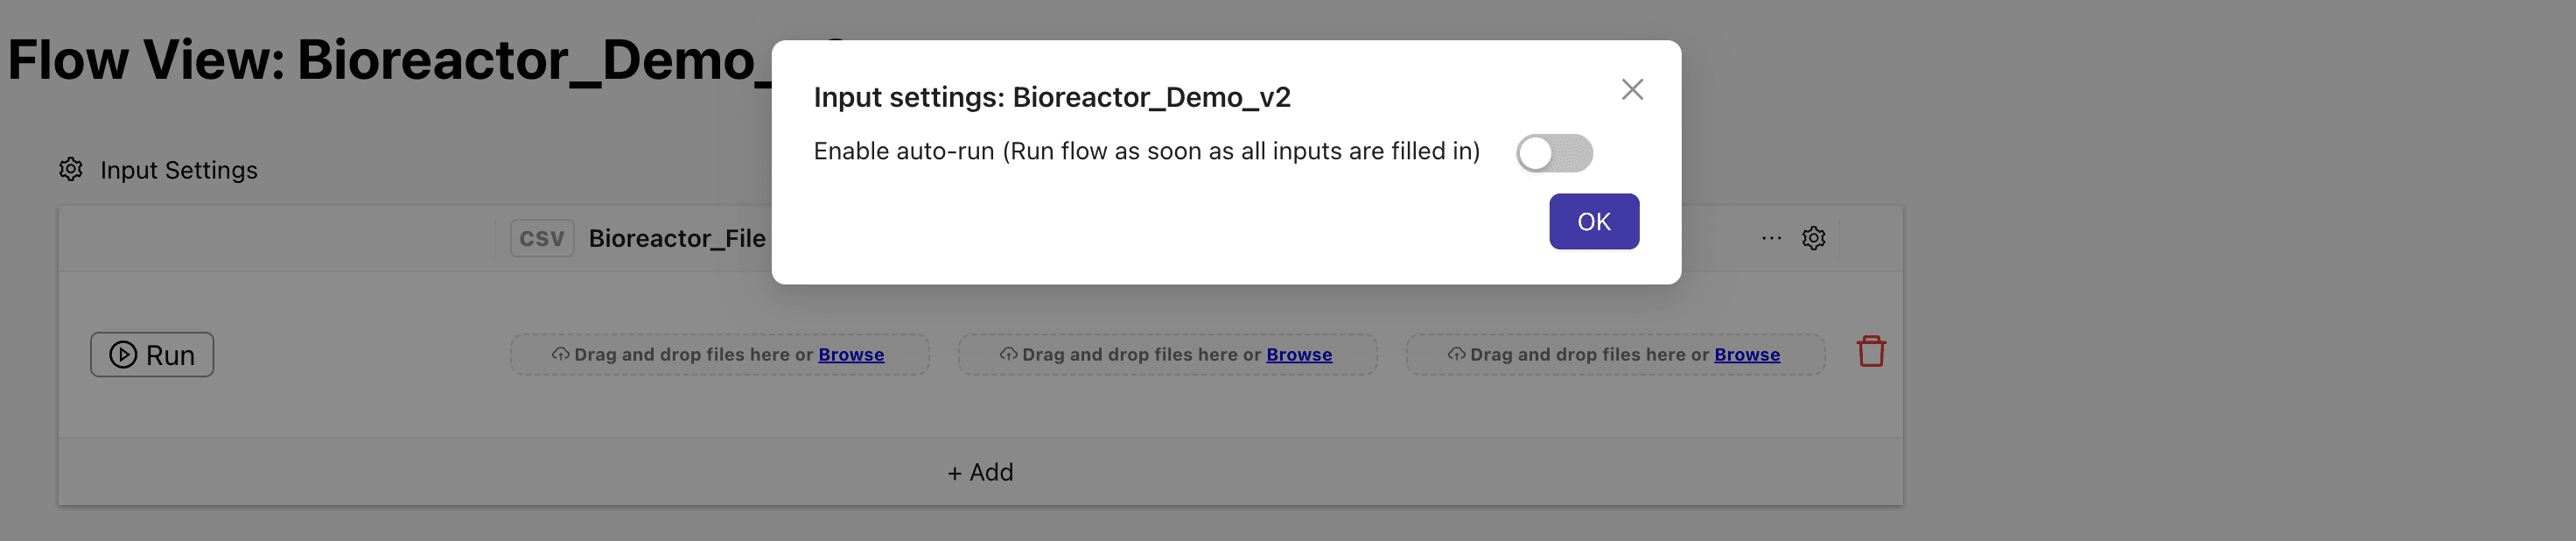
Flow status indicators
The Flow View page provides detailed status indicators at both the Flow and node levels to help you track the progress and outcomes of your Flows.
Flow-level status
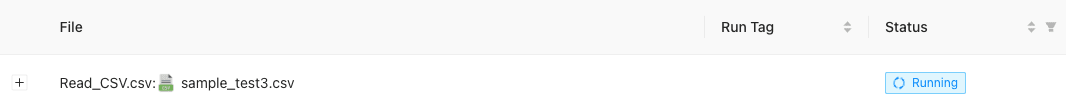
The Run History table displays status information for each historical run:
- File: The input files and parameters associated with the flow run.
- Run Tag: Tags associated with the flow run, such as a Benchling custom entity ID used to reference a table within Benchling.
- Status: The current status of the flow run. Possible status values include:
- Running: The job is currently in progress.
- Success: All nodes have successfully completed.
- Failed: At least one node failed to complete successfully.
Node-level status
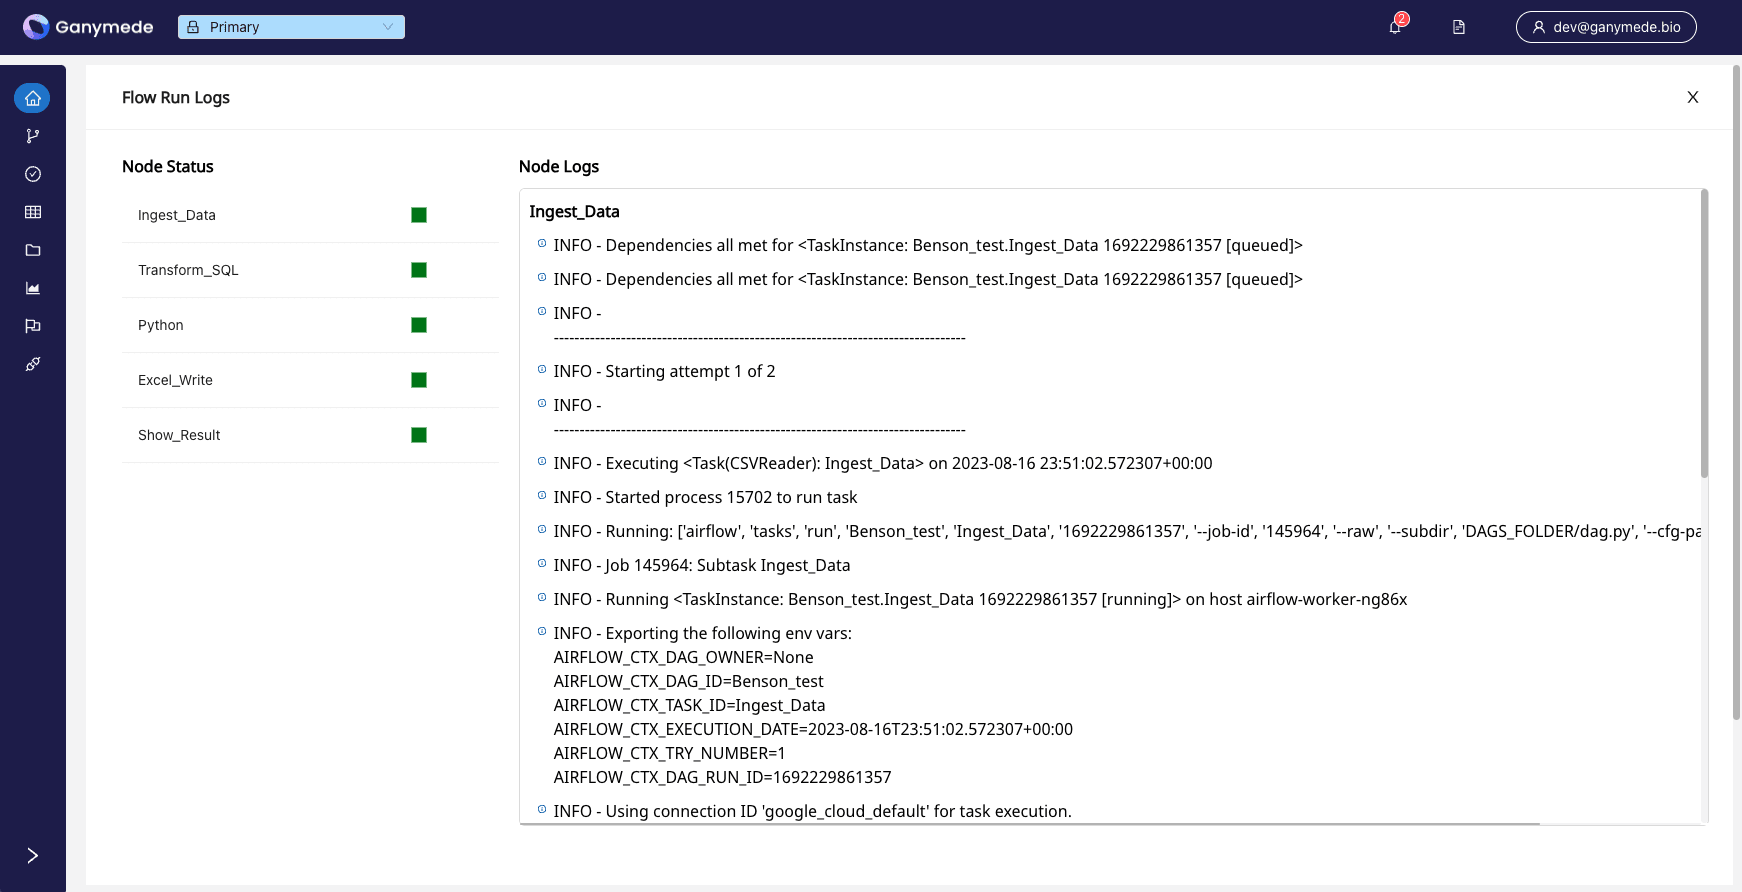
You can click the plus sign on the left side of each record in the Run History table to expand the view and display node-level status.
The color of the node status indicators reflects the current status:
 Red: The node failed after retries were exhausted.
 Light green: The node is currently running.
 Dark green: The node successfully completed.
 Gray: The node is queued and awaiting system resource to start.
 Yellow: The node failed at least once but is awaiting a retry.
 Orange: A dependency for the node failed, preventing this node from running.
Logs for each flow step can be accessed by clicking on the corresponding colored box.
Error Attribution
Developers using the platform can specify error types and messages associated with failed nodes using the GanymedeException class. These are displayed on the status tag in the Run History table. Below is an example code snippet that would be placed within a node to raise an error:
from ganymede_sdk.flow_runtime import GanymedeException

# available exception types are: Validation, Connection, Function
raise GanymedeException(message=”Peaks not detected in results”, exception_type=”Function”)
More detail on error types can be found in the GanymedeException section of the Ganymede SDK documentation.